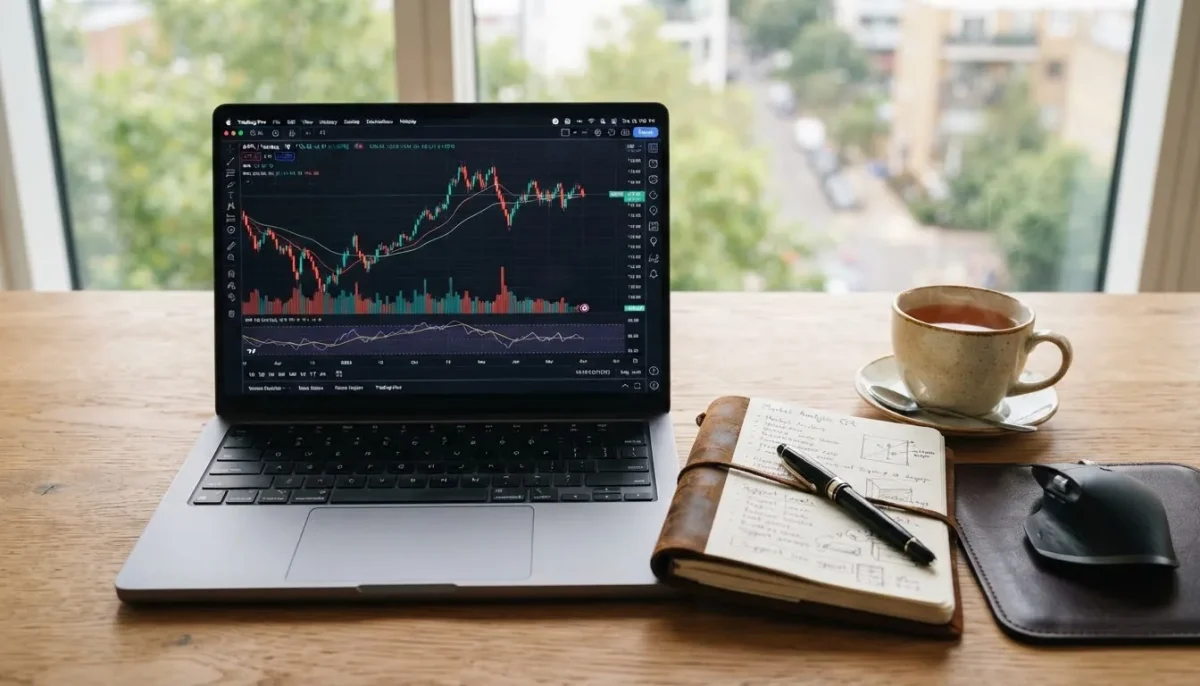
The first time you open a trading chart, it looks like a barcode that’s had a bad day. Red and green bars, thin lines poking out of them, all crammed together. Give it fifteen minutes, though, and each of those shapes turns into a small, readable story about what buyers and sellers did over a stretch of time.
Anatomy of a single candle
Every candlestick summarises one period — a minute, an hour, a day, depending on the chart setting — using four prices:
- Open — the first price of the period;
- High — the highest price reached;
- Low — the lowest price reached;
- Close — the last price of the period.
The thick part, the body, spans the open and close. The thin lines above and below, called wicks or shadows, reach to the high and low. If the close is above the open, the candle is usually green (or hollow); if it’s below, red (or filled). Colours are a platform setting, so check yours.
What the shape tells you
A long green body means buyers were in control from start to finish. A long red body means sellers were. Short bodies mean the period ended close to where it started — indecision.
Wicks are where it gets interesting. A long lower wick means price fell during the period but buyers pushed it back up before the close. A long upper wick means a rally was sold into. In both cases, the market tested a level and rejected it.
Patterns worth knowing first
There are dozens of named patterns. These are the ones you’ll see mentioned constantly:
Doji
Open and close almost identical, so the body is a thin line. It signals balance between buyers and sellers. After a strong trend, a doji can hint that momentum is fading.
Hammer and shooting star
A small body with a long lower wick (hammer) after a decline suggests buyers stepped in. The mirror image — small body, long upper wick — after a rise is a shooting star.
Engulfing
A two-candle pattern where the second body completely covers the first. A green candle engulfing a red one after a drop is “bullish engulfing”; the opposite after a rise is “bearish engulfing”.
Context beats patterns
This is the part most tutorials rush past. A hammer in the middle of nowhere means very little. The same hammer at a price level where the market has turned several times before, on a daily chart, with higher-than-usual volume, means a lot more. Ask three questions before acting on any candle:
- Where is it? Near support or resistance, or floating in the middle of a range?
- What timeframe? Patterns on daily and weekly charts carry more weight than on one-minute charts.
- Did the next candle confirm it?
A candlestick pattern is a clue, not a verdict.
From reading to trading
Candles help you decide where an idea is wrong — under the low of a hammer, for example — and that gives you a natural place for a stop loss. From there the rest is sizing: measure the distance in pips or points, choose a position that keeps the loss small, and pick the right order type to enter and exit. Remember that thin trading hours produce misleading candles in forex; the session guide shows when liquidity is best.
Candlestick charts work the same way on currencies, stocks, crypto and commodities like oil, which is why they’re the first chart type almost every trader learns.